Cost KPIs
The Figma IPO generated some buzz on Reddit recently but not for the reasons you might think. Redditors were aghast at the disclosure of their eye popping AWS bill of $300k per day! Sounds like a lot but is it a problem? Some suggest it’s not as bad as it looks.
As Frugal connects with more design customers, one theme keeps coming up: cloud costs vary wildly across companies. For CEOs, CFOs, and VPs of Engineering, this isn’t a trivial question. Cloud costs directly shape gross margins, profitability, and even your ability to scale efficiently. But what’s normal? Are your costs a problem that needs major attention or best in class?
Cloud Cost Management Metrics
There are many ways to measure costs but the simplest metric is: total cloud costs as a percentage of revenue.
This includes all services to build and host product:
- All environments (dev, test, prod)
- Major cloud platforms (AWS, GCP, Azure)
- Databases (Dynamo, Mongo, Snowflake)
- AI/ML services (Open AI, Claude)
- Observability (Datadog, Cloudwatch)
- Other third-party infrastructure or developer tools needed to build and host your product
Why the Answer Isn’t the Same for Everyone
You can’t just pick a % spend target and apply it evenly to all companies. What defines best in class will vary by a several important factors:
- Stage: Early-stage startups often show inflated ratios. They have less revenue and efficiency is as big a priority when in high-growth mode.
- Product type: A compute-intensive AI application will naturally carry higher cloud costs than a lightweight SaaS tool.
Cloud Cost Benchmarks (So Far)
Finding benchmarks isn’t easy, but here are a few data points worth noting:
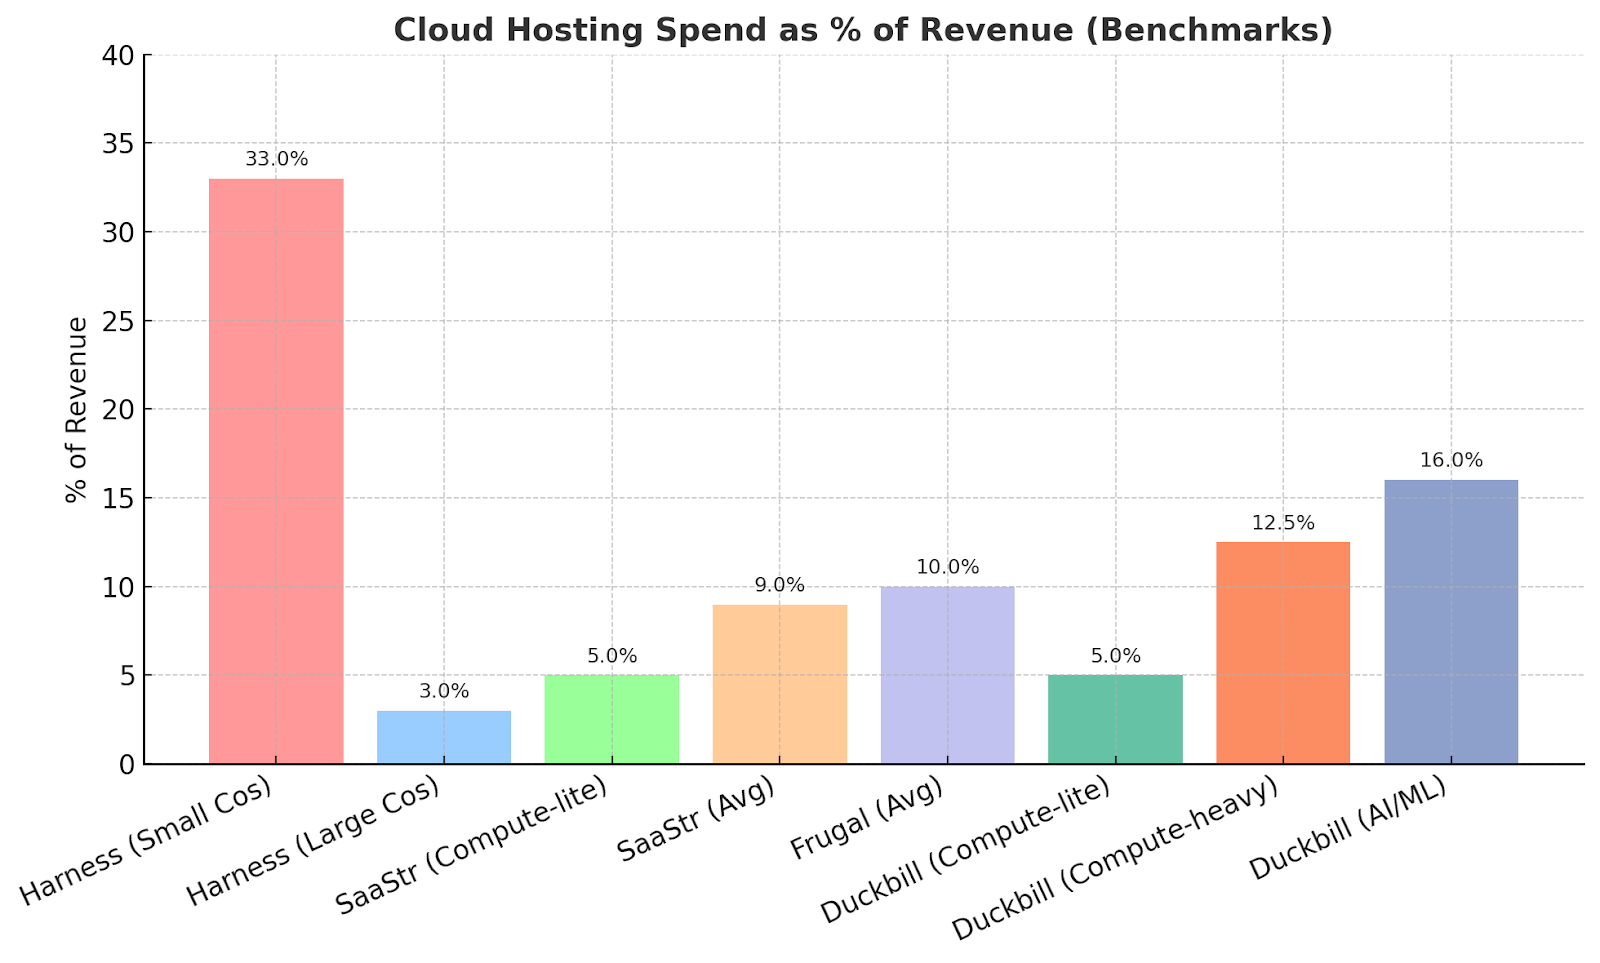
- Harness reported that small companies spend as much as 33% of revenue on cloud, versus 3% for large enterprises. (Frankly, the 33% number feels inflated compared to what we’ve seen in practice.)
- SaaStr’s Jason Lemkin suggests 5% of revenue if you’re compute-lite, and closer to 8–10% on average.
- Duckbill’s Corey Quinn suggests 5% for compute light, 10-15% for compute heavy and +15% for AI/ML companies. There’s been reports that OpenAI’s gross margin is only 50%, which would substantiate Corey’s view on AI companies.
- At Frugal, we’re seeing customer ranges between 5–15%, depending on stage and workload intensity. 10% is most common but can be higher with early stage and less than 10% for +$100m companies.
What Do Best in Class Cloud Cost Metrics Look Like?
The data above is a good start but clearly there’s more research needed here. We need more data and better benchmarks for companies of different sizes and workloads before we can start judging what is best in class.
In the meantime, we can try to estimate this by making some assumptions. Gross margins are widely reported on but not cloud costs specifically. The Figma S1 was not typical, most do not break out specific sub components of their cost of revenues. However, if we assume 33% of Gross Margins are related to hosting and 80% of cloud costs are for hosting production vs. test or staging. Applying these assumptions to the data from 132 public SaaS companies we can see the following:
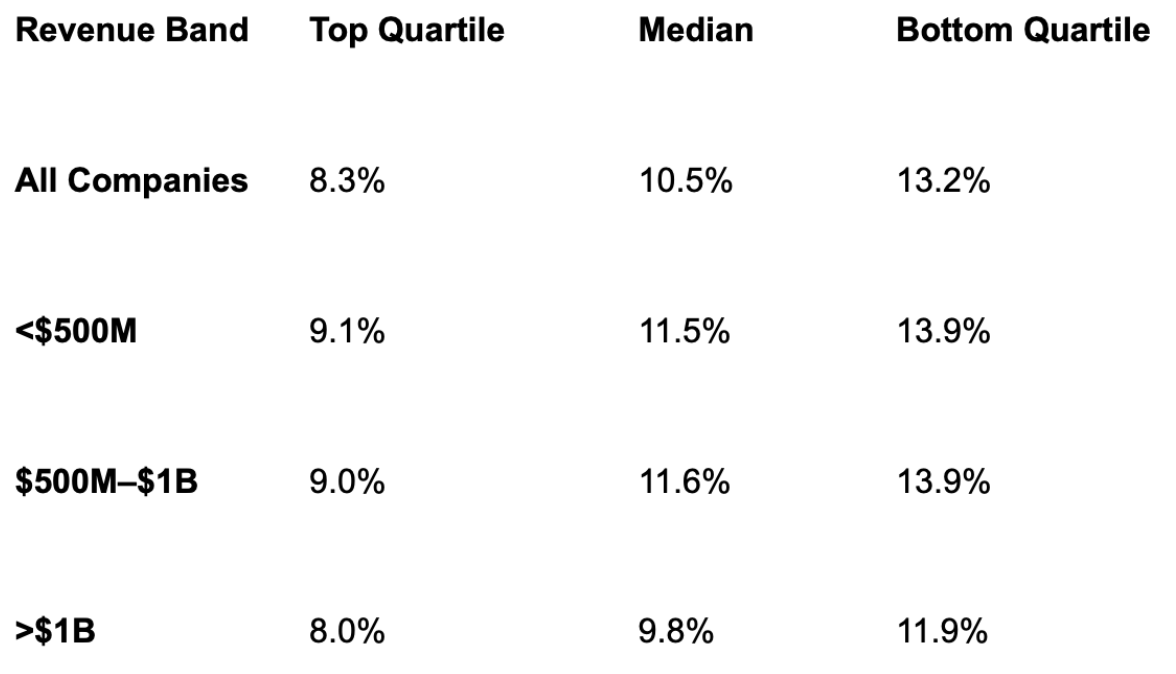
Average spend (Total Cloud Cost / Revenue) is 10.5%. The best companies are spending less than 8.3% and the highest spending companies are above 13.2%. Surprisingly, the numbers are not radically different by revenue band. I suspect we'd show more interesting variation for sub $100m companies but there was none in the public data.

Again this is only a guestimate based on Gross Margins but still offers some view into what would constitute best in class efficiency. In order to really answer the question, we’ll need the actual spending numbers - which leads to a request below.
Join the Benchmarking Effort
We’d like to collect more real-world data to answer this question more definitively. If you’d like to contribute, please take this short, anonymous, 1 min survey. We’ll publish the aggregated findings so every leader can better understand whether their cloud costs are healthy or a red flag.
We’ll also be publishing more data on this subject going forward like how AI is changing overall spend and other interesting topics. Join our email list to be notified when new content is available.